Contents
Key Takeaways
- A company ownership chart shows the identity of the Ultimate Beneficial Owner (UBO) and the shareholding of a given company at a glance.
- Banks will request a hierarchical ownership chart from you as part of their due diligence protocols.
- Clear and organised ownership structure charts increase chances of bank account opening, and software like Microsoft Excel and Microsoft Visio offer tools to create these charts.
In an increasingly complex business world, it comes as no surprise that even companies with big names are only small units within a complex web of ownership, formed by companies and individuals who control myriad other companies. Luckily, the company ownership chart is designed to help us untangle that web and make sense of even the most complex of ownership structures.
What is an Ownership Structure Chart?
A share is a unit of ownership within a company. By purchasing shares, investors own a percentage of the company.
Ownership can be split between voting rights and economic rights. Economic rights refer to the owner’s right to a portion of the company’s profits, while voting rights refer to the ability to influence the appointment of the company’s officers. A shareholder’s voting rights and economic rights are often directly proportional to the percentage of shares they own in the company.
A company ownership chart is a visual that makes plain the shareholding structure (or percentages) in a company. It also reveals the identity of its Ultimate Beneficial Owner (UBO), the natural person who owns more than 25% shares or voting rights. As we will see below, the UBO is often placed at the top of the flow chart hierarchy.
Positions in a company chart: what do they mean?
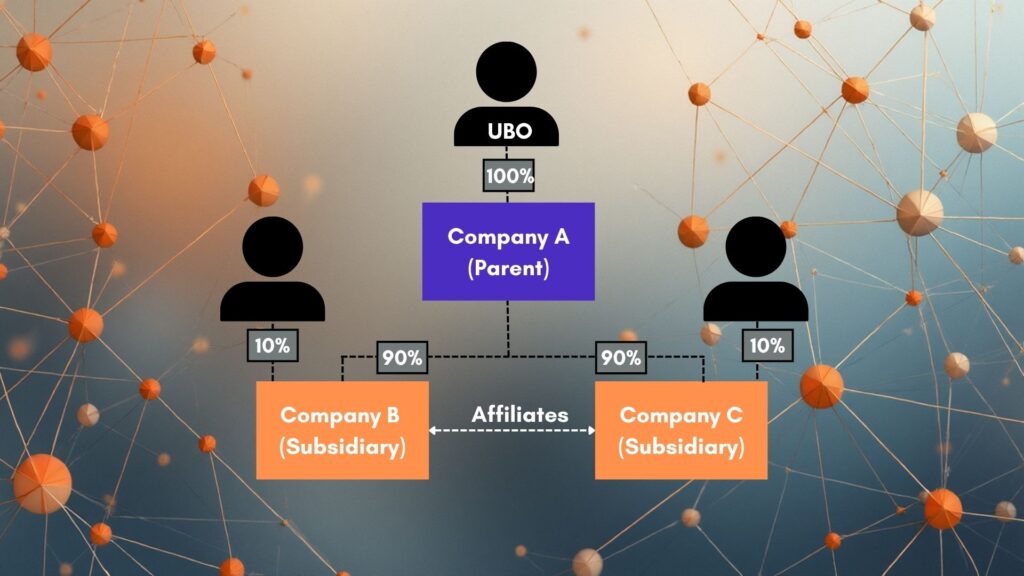
Shareholders can be people as well as corporations. A parent company is one that owns shares in another company (its subsidiary). To reflect this ownership structure, the parent company is placed above the subsidiary within the hierarchy. In the diagram below, Company B is a subsidiary of Company A.
An affiliate is a company that shares a common control with another company. Affiliates are placed on the same level as each other, much like companies B and C in the diagram below.
Which kind of flow chart hierarchy to show banks?
The ownership chart is often confused with the organizational chart (or the “org chart”), but they only look similar. Where the ownership chart shows shareholding structures, the org chart lays out management structures (i.e. the number of departments in a company, employees in each department, the managers or CEOs they report to).
Though banks often require that you submit both an org chart and an ownership chart for application purposes, it is the latter that will determine whether you’ll pass due diligence protocols. Following the Financial Action Task Force’s (FATF) establishment of global anti-money laundering standards, banks have adopted stricter regulations to verify the identities of company members before offering any banking services.
It is therefore standard protocol to present banks with information about your company’s UBOs. In companies owned by corporations that are owned by yet other corporations, the identities of UBOs may be obscured. Such companies would likely be extensively questioned about the individual at the top of the shareholding hierarchy before their applications are approved.
How do you prepare a shareholding structure chart?
Start by organising individuals and/ or companies into hierarchical relationships, with UBOs and parent companies occupying the higher positions, and the subsidiaries occupying the lower positions in the chart.
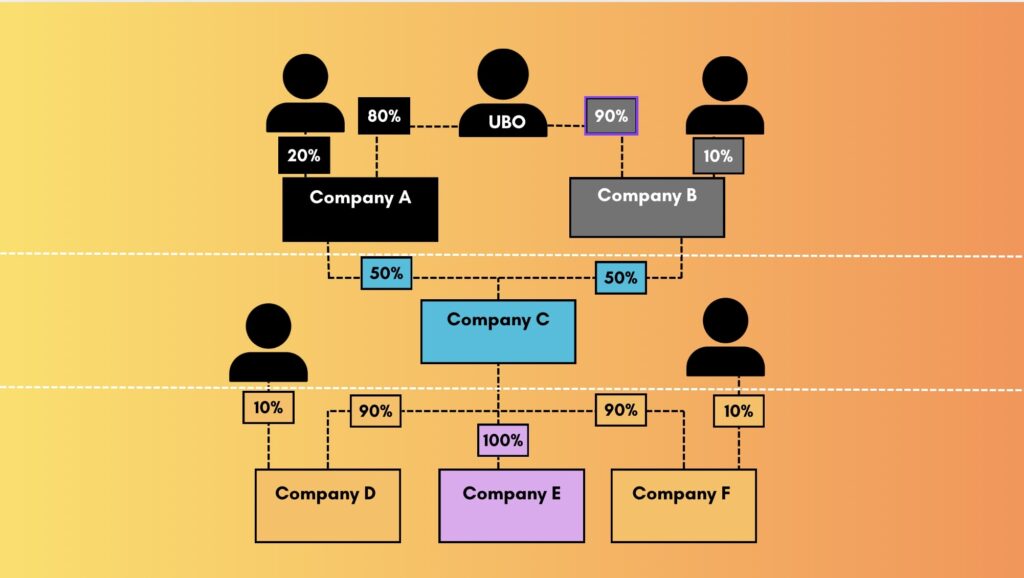
Ensure that entities on the same level of ownership are grouped on the same horizontal axes, as in the diagram above.
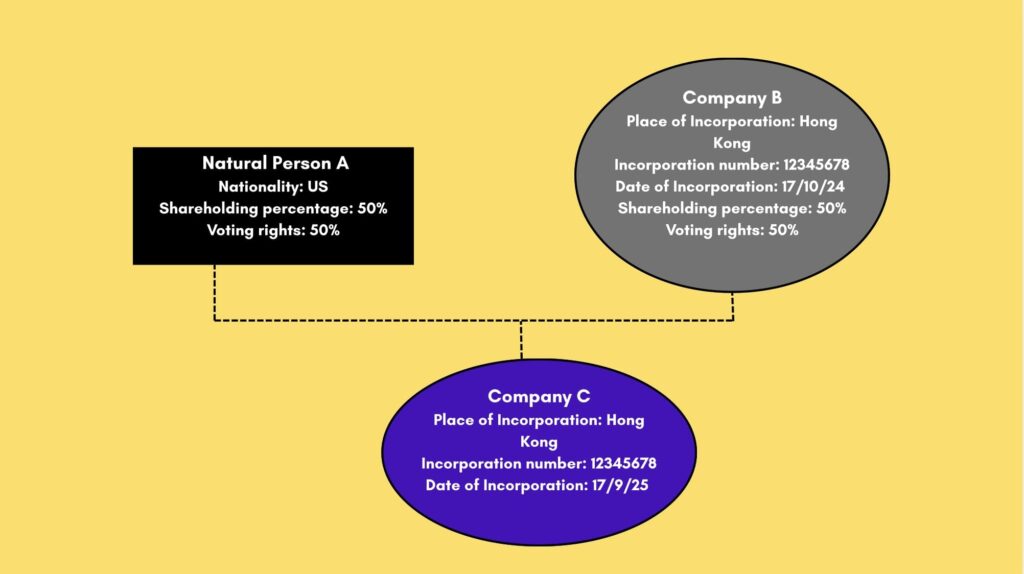
The following information should be provided for individuals and corporations on an ownership hierarchy:
| Corporation | Natural person | |
| Full name | ✓ | ✓ |
| Nationality | ✓ | |
| Place of incorporation | ✓ | |
| Date of incorporation | ✓ | |
| Incorporation number | ✓ | |
| Voting rights as a percentage | ✓ | ✓ |
| Shareholding percentage | ✓ | ✓ |
When creating the chart, use software that is simple to use. The most popular software include Microsoft Excel and Microsoft Visio.
Clarity and organisation are key. For example, you may use circular cards to represent companies, and rectangular cards to represent natural persons. However, only introduce variations in colour and shape if it will enhance the organisation of information. Try to ensure that colours, fonts, and spacing are uniform.
Last but not least, format the chart in a single page, so that the banker will know who owns the company at a glance. Include essential information, and avoid inserting big paragraphs into cards.
Creating an ownership diagram is the first step in putting together a successful application to banks. A clear diagram communicates a sense of transparency and organisation, increasing the bank’s trust in you and your new business. As long as you use the right tools and include all the essentials, you will be able to navigate tightening AML regulations with ease.
Frequently Asked Questions
1. What is a corporate ownership chart?
A company ownership chart is a visual that makes plain the shareholding structure of a company. It is also one that reveals the identity of its Ultimate Beneficial Owner (UBO)—the natural person who possesses significant control over the company. This is often an individual who owns more than 25% shares or voting rights.
2. What determines ownership of a company?
Investors obtain ownership in companies by purchasing shares. Ownership can be split into voting rights and economic rights. Economic rights refer to the owner’s right to a portion of the company’s profits, the size of which is often directly proportional to the number of shares purchased; voting rights, on the other hand, refer to an ability to influence the appointment of the company’s officers.
3. What is ownership structure?
Ownership structure refers to the shareholding percentages in a company. Individuals and companies can both own other companies. That is why, within an ownership structure, there may be corporations as well as natural persons. At the top of the structure, however, is always the UBO.
4. How to create a business structure chart?
You may use software like Microsoft Visio, Microsoft Excel. No matter what software you select, it is important to familiarise yourself with the full suite of tools that it offers. Make sure that you are able to show clear hierarchical relationships and include all the essential information, such as shareholding percentages, voting rights, etc.