
Alfred Loo Get Started HK Limited
CW Chung & Alan Lam Lingnan University, Hong Kong
Analysis of Attendance and Performance
It will be useful if we can predict students’ performance in examination. We have collected about 120 students’ attendance records, Mid-term marks, marks of assignments and final examination of a quantitative course. This course is a compulsory year 1 university course. It is considered as difficult by the students. The analysis results are presented in this paper. The results enable us to better understand the education processes.
1. Background Information
The current business environment is awash in large amounts of data that ongoing transactions continually generate. Leading-edge corporations are using business analytics to achieve competitive advantage. However, according to Kolata (1997), business faculty generally resists increasing the quantitative literacy of business students because they believe that:
(a) all business students do not need much mathematics beyond the high school level except for a course in statistics (b) calculus is an unnecessary hurdle. This reluctance to increase the emphasis on quantitative literacy has resulted in it being practically nonexistent in business curricula.
Quantitative courses account for a significant portion of business schools’ curricula. According to AACSB (The Association to Advance Collegiate Schools of Business) standards, business schools’ curricula should contain a number of quantitative courses, such as decision science, management science, and statistics (AACSB International, 2010). In a paper, McClure and Sircare (2008) concluded that to compete globally and prepare business students for the future, the following are necessary:
(a) the increased use of quantitative methods in the core of the undergraduate business program (i.e., the required courses); (b) a modification of the quantitative tools covered to meet emerging requirements in business; and (c) the use of sophisticated computer software, now commonly available to all organizations, to make even complex computations relatively straightforward for the ordinary manager.
On the other hand, a lot of business students consider quantitative courses to be difficult. These students do not get good results in the final examination. Thus it is important for us to find out factors which can improve their performance.
We have collected about 120 students’ attendance records, marks of assignments, midterm test and final examination of a quantitative course. This course is a compulsory course in Business Faculty. The analysis results are presented in this paper. The results enable us to better understand the education processes.
2. Related WorksA lot of papers explored the underlying factors which are central and necessary to enable a registered student in introductory courses of quantitative techniques to succeed in these fields. For example, Jamelske (2009) presented numerous determinants of success in university introductory quantitative courses. Some researchers studied the effects of time allocation (Hlavac, Peterson and Piscioneri, 2011). and other factors (Lo, 2010; Dunegan, 2010). We summarised their works in the following sections.
2.1 Active LearningIntroductory quantitative courses, just like any other courses, require active participation and possible engagement of students as they learn the course’s subject matter (Felton and Koper 2005). Learning new methods and making discoveries is interesting and makes the whole process of learning creative and intriguing for those who engage and learn to appreciate new horizons brought about the possibilities and constraints of the quantitative course. In Felton and Koper (Felton and Koper 2005) study of ‘A Simple Adjustment That Compensates for Grade Inflation, Assessment & Evaluation in Higher Education’, they stated that students have more interest in their introductory courses, find it easier to pass their end of semester exams. In addition, students who appreciate what new methods and problems that the quantitative course can bring and face them have always succeeded (Felton and Koper 2005). On the same note, those students who learn the logical reasoning processes of the quantitative course ensure that at all time, they understand the critical certainty the challenge and the solutions it can offer.
2.2.Mathematics PreferenceMajor studies have been on the previous success of the student in mathematics lessons in high school (Johnson and Kuennen, 2006). Quantitative courses commonly referred as quantitative techniques are referred to as mathematical tools used in mathematical demonstration in business. According to Johnson and Kuennen (2006), these business and economic models are used to explain real business behavior and real life economic situations. Examples of these economic models include demand analysis, supply behavior, market analysis and price cycles. For these pointed analyses to be full explained, they need many operational quantitative techniques such as mathematical simulations and programming. For this reason, a student intending to enroll in quantitative courses at university must have a great and smart background in mathematics and who regard mathematics as their favorite course. Studies of high school mathematics as a major determinant to the success of a student in a quantitative course reveal that, there is a strong positive correlation between the score of high school mathematics grade and performance of quantitative courses in the university (Johnson and Kuennen, 2006). They further show that most introductory quantitative courses in the university points to and is a reminder of mathematics basics learnt in high school. Therefore, if a student tends to fail in these courses, then this is an indication that this student’s high school performance in mathematics was low. The Study by Marianne and Kuennen (Johnson and Kuennen , 2006) indicates that introductory quantitative courses include calculus and programming. It so happens that these two topics are common in the secondary school mathematics syllabus. Proving that, high school mathematics performance is a determinant of student’s success in quantitative courses in the university.
2.3 Lecture AttendanceAccording to Durden and Ellis (1995), attendance of a student in all the lessons is a great determinant to the success of a student in a quantitative introductory course. According to their suggestion, attendance is a compass of a wide area. Stanca (2006) continued to show that proper attendance include being punctual, that is, coming to the class or lecture-room before the lecture commence. This is particularly significant because any slightest concept missed means that, the subsequent concepts will be irrelevant. Stanca (2006) also pointed out that quantitative courses involve a progressive buildup of concepts. One chapter; one course is a prerequisite of another— meaning that the current concept is a continuation of the old concept. Thus, the consistence of a student to attend frequently and regularly lecture lessons is not a loss but a progressive gain. The study revealed that 70% of the students who were prompt in lecture attendance have not only succeeded, but also shown great improvement in the quantitative introductory courses.
2.4 Prior Performance in Numerical DisciplinesAnderson et al’s (1994) results showed that the students Grade Point Average (GPA) have statistically positive effect on quantitative introductory courses. On the same note, they stated in ‘The Determinants of Success in University Introductory Economics Courses’ that, the prior performance in numerical disciplines such as accounting, basic economics and calculus have also positively contributed to students’ success in quantitative courses. According to the research study (Dunegan 2010) on GPA, it is revealed that those students who had their majors in high school as humanities and linguistics and were allowed to take introductory quantitative courses performed dismally when they were compared to those who had their majors in high school as sciences. For this reason, the high school major positively affected the success of a student in his or her introductory quantitative course. Their investigation on high school score as a determinant of the success of a student in his or her introductory quantitative courses suggests that the level of a high school score is an indicator of a student’s intelligence. For instance, the highest score being an “A” and the lowest score being an “E”; a student to score an “A” is an indication that on general scale this is an intelligent student. Most of these students who score at this highest level have a tendency to handle harder and involving tasks. Their intelligence quotient is high and always perceives ideas as manageable (Felton and Koper 2005). According to Felton and Koper (2005), students who perform highly in class if subjected to any field, they have the tendency to adapt. Therefore, a higher performance while majoring in high school is not determination to a student prerequisite to take and succeed in a quantitative introductory course. Thus, the proponents for the high school major failed to fill this gap. This is a shortcoming to their study as exhaustively it did not cover to justify it is study (Hlavac 2011).
2.5 AttitudesResearch on course related factors (Jamelske 2009) showed that a student’s attitude in deciding to take the quantitative course has come into play. In his research, he employed a good number of variables his investigation including job prospects, psychological mobility, and history of discipline, the easy with which one can handle other courses in the same discipline or in other disciplines. He selected sample of 100 students and used likert scale type of questionnaire and students were asked to rank the variables in the order of preference. Among the factors that took the center stage include, the job prospect and psychological mobility. According to this report, 70% of these students with the notion pass introductory quantitative courses were observed. On the other hand, 10% of this had no idea of what career one can develop out of the quantitative techniques in their introductory quantitative courses. The issue of psychological mobility emerges by the fact that most students have the tendency to copy from one another. Close friends and who happen to have been competing in high school, continually keep following what other the friend has done and even to career selection what the other friend has enrolled in (Jamelske 2009).
Research on course related factors (Jamelske 2009) showed that a student’s attitude in deciding to take the quantitative course has come into play. In his research, he employed a good number of variables his investigation including job prospects, psychological mobility, and history of discipline, the easy with which one can handle other courses in the same discipline or in other disciplines. He selected sample of 100 students and used likert scale type of questionnaire and students were asked to rank the variables in the order of preference. Among the factors that took the center stage include, the job prospect and psychological mobility. According to this report, 70% of these students with the notion pass introductory quantitative courses were observed. On the other hand, 10% of this had no idea of what career one can develop out of the quantitative techniques in their introductory quantitative courses. The issue of psychological mobility emerges by the fact that most students have the tendency to copy from one another. Close friends and who happen to have been competing in high school, continually keep following what other the friend has done and even to career selection what the other friend has enrolled in (Jamelske 2009).
The study on attitude of students who enroll for quantitative courses has in the recently been a case of study for most researchers (DePaolo and McLaren 2006). The right attitude according to their study is one major determinant to the success of a student in this degree program. Most of these students normally do well in these introductory courses. According to the study on this behavior, over 99% of this category passes their introductory courses of quantitative techniques. Another category of the students is those who have the passion to do the management science in which he or she will learn quantitative techniques. They suggested that this passion has no relationship at all to the level of performance of the quantitative techniques. That way most of these students who have enrolled for quantitative degree course out of passion 50% do well. This is an average number of those who do well in the introductory quantitative courses. Therefore, to some extent passion is a determinant of the success of a student in his/her introductory quantitative courses (DePaolo and McLaren 2006).
3. Analysis ResultsWe collected the marks of assignments, mid-term test and examination from 122 students in a first year quantitative course. Their attendance records were collected. Correlation analysis was conducted to verify whether there are any correlations.
3.1 Assignments and Examination QuestionsAssignments are paired with examination questions according to their similarities. The regression analysis results are presented in Table 1 to 3. Correlations are significant at the 0.01 level in all three tables. The valid number (N) is less than 122 because some students did not submit their assignments. There are positive correlations in all cases.
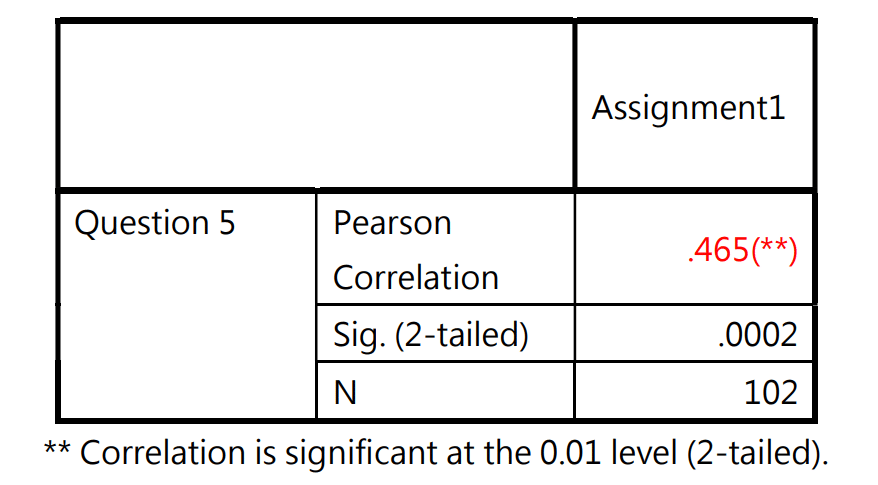 Table 1: Correlations of Assignment1 and Question 5 in the examination
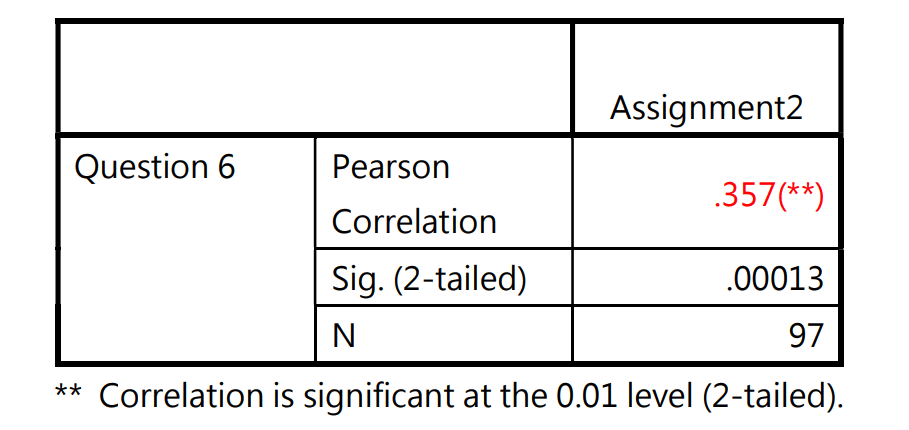 Table 2: Correlations of Assignment2 and Question 6 in the examination
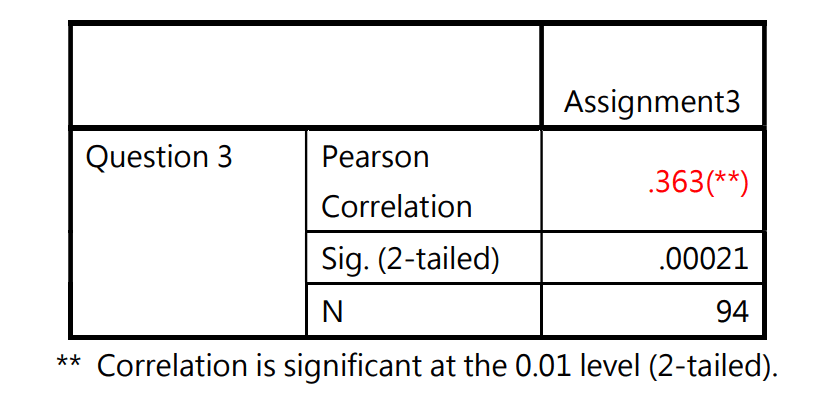 Table 3: Correlations of Assignment3 and Question 3 in the examination
3.2 Mid-term test and attendance
Table 3: Correlations of Assignment3 and Question 3 in the examination
3.2 Mid-term test and attendance
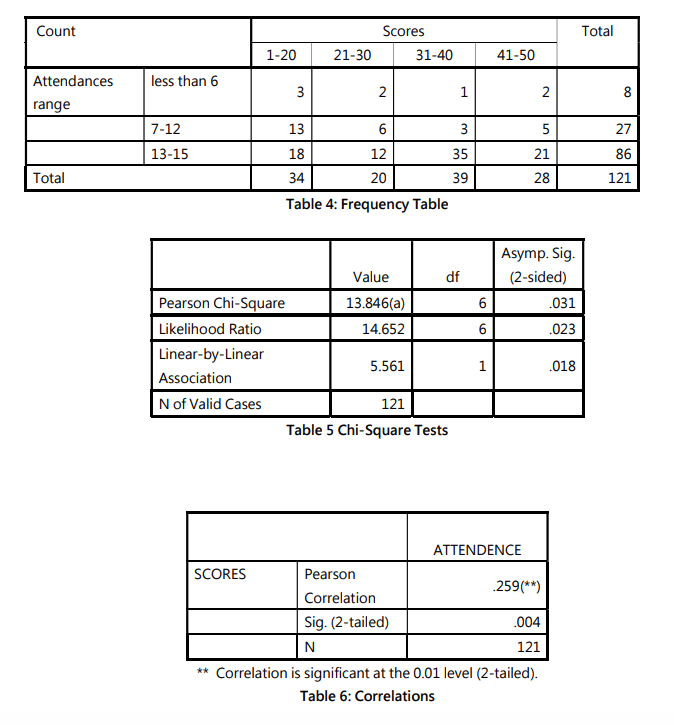
The analysis results are presented in Table 4, 5 and 6. There is a positive linear relationship between the attendances and the mid-scores at 95% confidence level. The Pearson correlation is about 0.259. The valid number (N) is 121 because one student did not attend the mid-term test.
 3.3 Final Examination and Attendance Records
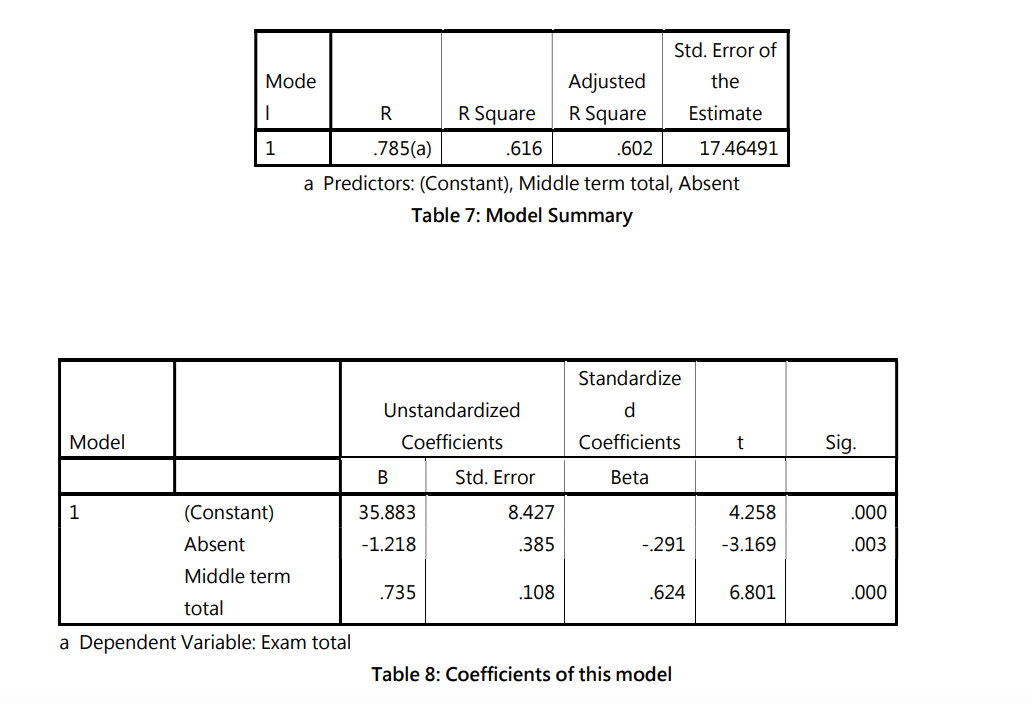
The multiple regression analysis results are presented in Table 7 and 8. All students (N=122) attended the final examination. The coefficient of determination (r2 ) is 0.616. There is a positive linear relationship between “final examination score” and “mid-term mark”. On the other hand, there is a negative linear relationship between “final examination score” and “number of absence”. The large t values in table 8 also suggest that there are strong evidences of the relationships. Finally we have the following equation.
Total final Exam scores=35.883-1.218*Absent+0.735* Middle term mark
4. Conclusion and Future Research
We have identified the important factors which will affect students’ performance. The results enable us to better understand the teaching and learning processes. We can also predict the performance of our students with our model. It is useful because we can identify students who have problems. Professors can pay more attentions to these students and help them improve. As learning is a complicated process, more studies should be carried out in future to include more factors.
Citation Suggestion:
Alfred Loo, CW Chung and Alan Lam, “Analysis and of Attendance and Performance”, working paper # Getstarted/2020082901, available from https://getstarted.hk/joint-working-paper-2020082901
ReferencesAACSB International. (2010). Eligibility procedures and accreditation standards for business accreditation, USA, P.8 and P.69.
Anderson, G., Benjamin, D., and Fuss, M. (1994). The Determinants of Success in University Introductory Economics Courses. The Journal of Economic Education, 25(2), 99-119.
Carraway, Robert and Clyman, D. R. (2000). Integrating Spread sheets into a Case-based MBA Quantitative Methods Course: Real Managers Make Real Decisions. Informs Transactions on Education, Vol 1, No. 1 38-46.
DePaolo, Concetta and McLaren C. H. (2006). The Relationship Between Attitudes and Performance in Business Calculus. Informs Transactions on Education, Vol 6, No. 2 8-22.
Dunegan, Ken (2010). GPA and Attribute Framing Effects: Are Better Students More Sensitive or more Susceptible? Journal of Education for Business, 85, 239-247.
Durden, Garey. C., and Ellis, L. V. (1995). The Effects of Attendance on Student Learning in Principles of Economics . The American Economic Review: 85(2), 343-346.
Eskew, Robert. K., and Faley, R. H. (1988). Some Determinants of Student Performance in the First College-Level Financial Accounting Course. The Accounting Review, 63(1), 137-147. Retrieved September 28, 2011, from http://www.jstor.org/stable/247684
Felton, James and Koper, P. T. (2000). Nominal GPA and Real GPA: A simple adjustment that compensates for grade inflation. Assessment and Evaluation in Higher Education, 30(6), 561-569.
Hlavac, Jim., Peterson, J., and Piscioneri, M. (2011). Time Allocations for Study: Evidence from Arts Students in Australia. Education and Training, 53(1), 27-44.
Jamelske, Eric. (2009). Measuring the Impact of a University first-year experience program on Student GPA and retention. High Education, 57, 373-391.
Johnson, Marianne and Kuennen, E. (2006). Basic Math Skills and Performance in an Introductory Statistics Course. Journal of Statistics Education, 14, (2). Retrieved September 28, 2011, from www.amstat.org/publications/jse/v14n2/johnson.html
Kolata, G. (1997). Understanding the news. In L. A. Steen (Ed.), Quantitative literacy fortomorrow’s America (pp. 23–29). New York: The College Board.
Lo, Celia C. (2010). How Student Satisfaction Factors Affect Perceived Learning. Journal of the Scholarship of teaching and learning, 10(1), 47-54.
McClure, R. and Sircar, S. (2008). Quantitative Literacy for Undergraduate Business Students in the 21st Century. Journal of Education for Business vol 83 iss. 6 (Jul/Aug 2008): 369-374.
Stanca, Luca (2006). The Effects of Attendance on Academic Performance: Panel Data Evidence for 10 Introductory Microeconomics, The Journal of Economic Education, vol 37, iss 3, 251-266.
Taipia, Martha. and Marsh George (2001). Emotional Intelligence: The Effect of Gender, GPA, and Ethnicity. Paper presented at the Annual Meeting of the Mid-south Education Research Association, Little rock, Arkansas, November, 14-16.